Visual Triggers: Graphical Methods for Capturing Bursts and Other Complex Signals on Oscilloscopes
- 11 Dec 2020
Capturing and finding the right characteristic of a complex signal can require hours of collecting and sorting through thousands of acquisitions for the event of interest. Defining a trigger that isolates the desired event and shows data only when the event occurs will speed up this process.
Visual Triggering on an oscilloscope makes the identification of the desired waveform events quick and easy by scanning through all analog waveform acquisitions and comparing them to on-screen areas or geometric shapes. This blog post discusses some common challenges with capturing events of interest within complex signals and how to overcome them using the capabilities of Visual Triggering.
Basic Oscilloscope Triggering
Oscilloscopes contain a specialized hardware circuit called a trigger which allows predictable acquisition and display of time-correlated signals. The trigger makes repetitive waveforms appear stationary by displaying the same portion of the input signal at the same horizontal position on the oscilloscope display.
Edge triggering is the simplest trigger mode, which identifies a portion of the signal that crosses a specified threshold level and then positions that cross-over point at the trigger point on the display. Advanced trigger modes – including runt, glitch, pulse width, timeout, transition, pattern, state, setup/hold violation, window, serial pattern, or sequences of these events – allow specification of more complex signal characteristics.
However, even the most advanced oscilloscope trigger hardware can only identify a limited number of signal characteristics, and those characteristics must be specified with numerical values such as voltage levels or pulse widths. Oscilloscopes are visual devices and many users would like to graphically interact with the instrument, especially when working with complex signals.
Some oscilloscopes allow the user to draw a “box” on the display (with a mouse or touch-screen) to define an area for graphical zoom, histogram analysis, or measurement gating. The Visual Trigger application extends this graphical capability to allow definition of trigger criteria.
Visual Trigger
Visual Trigger makes the identification of the desired waveform events quick and easy by scanning through all acquired analog waveforms and graphically comparing them to geometric shapes on the display. By discarding acquired waveforms which do not meet the graphical definition, Visual Triggering extends the oscilloscope’s trigger capabilities beyond the traditional hardware trigger system.
Although Visual Trigger is similar in appearance to mask testing, where acquired waveforms are graphically compared to mask regions on the display, there is an important difference. Visual Trigger actually discards waveforms which do not conform to the specified shape, so only conforming waveforms can be displayed, measured, and saved to a reference.
In this blog post, screenshots from the 5 Series MSO/6 Series MSO are used to demonstrate the capabilities of Visual Triggering.
Basic Setup
The Visual Trigger process always begins with setting up the oscilloscope’s hardware trigger system to acquire the waveforms in Normal trigger mode. The trigger can be as simple as an edge trigger or as complex as a parallel or serial bus trigger, or a sequence trigger.
The next step is to add one or more Visual Trigger areas using a mouse or touchscreen. By default, the shape is a rectangle, but variety of other shapes (triangles, hexagons, trapezoids, and custom shapes) can be used to specify the desired trigger behavior. Once shapes are created on the oscilloscope's display, they can be re-positioned, re-sized, and/or edited interactively to create ideal trigger conditions.
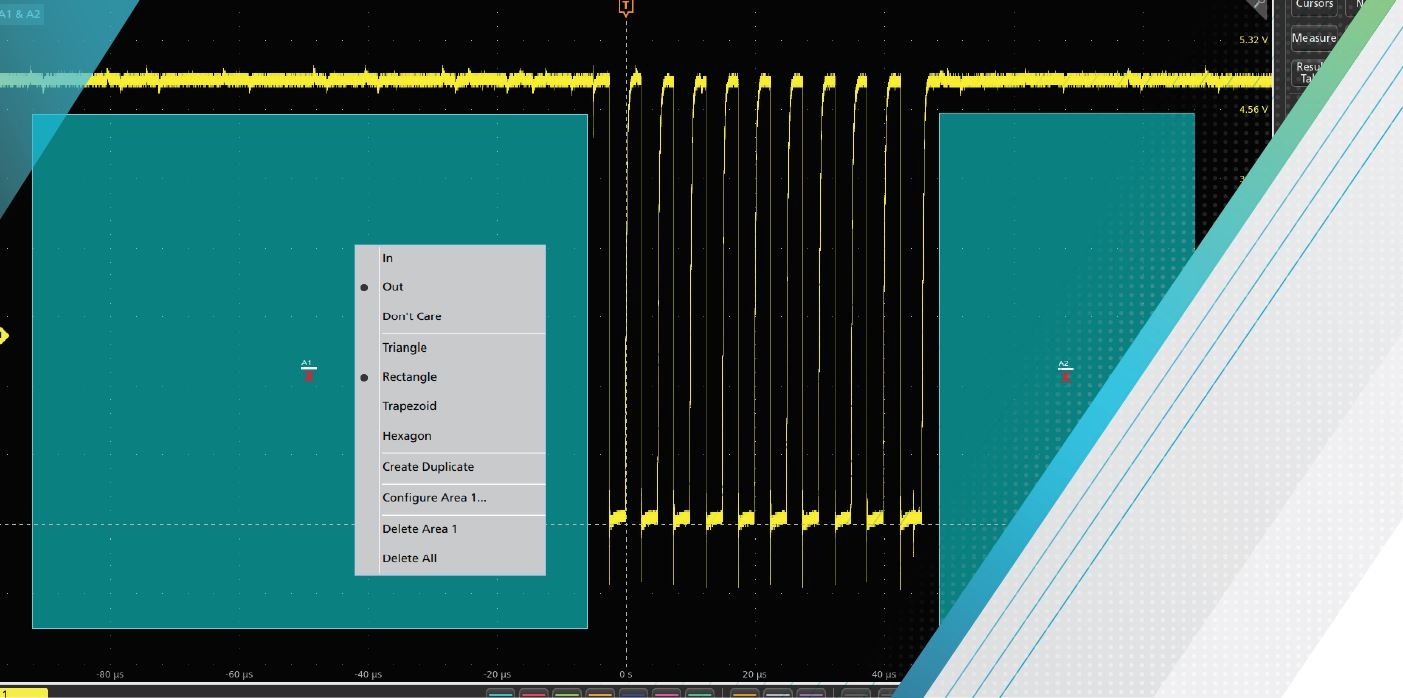
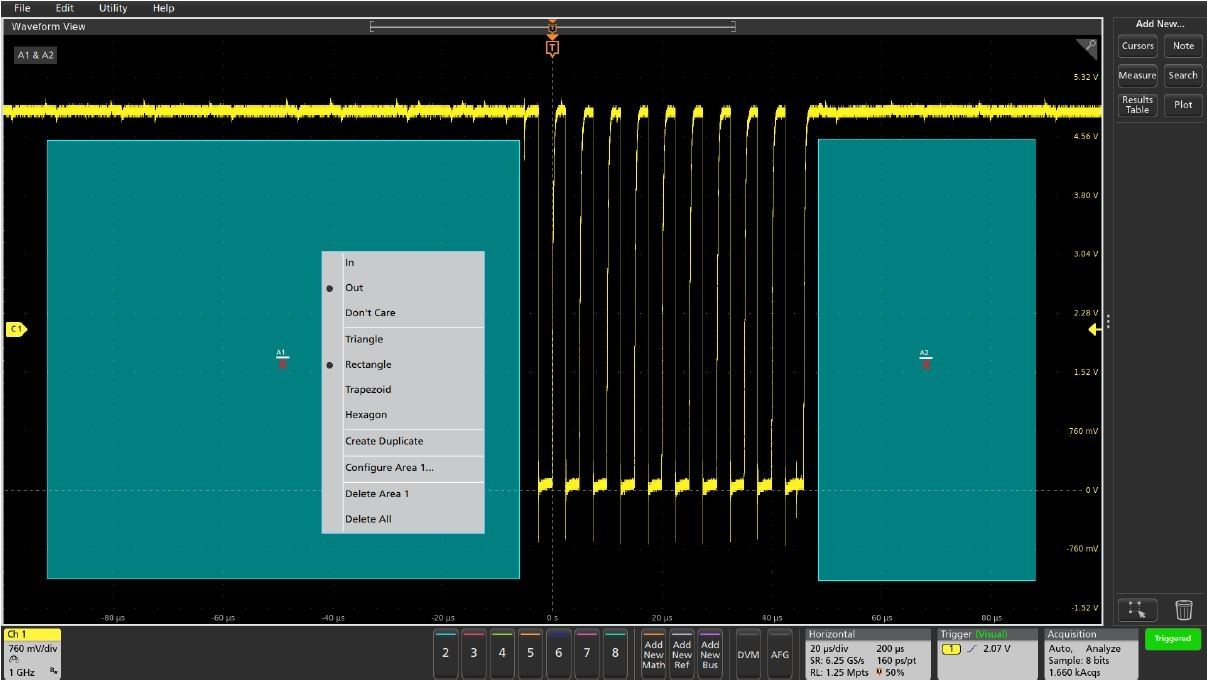
Each of the visual trigger areas is associated with a specific analog input channel. Once created, the user can change the shape of the area, change whether the signal must go inside or stay outside of the area, create a duplicate area, or delete the area. Basic Visual Trigger controls are simply a "right-click" away.
The example above shows a bursty I2C clock signal. To capture only bursts of a specific width, one Visual Trigger area is placed before the trigger point and another after the end of the desired burst width. By specifying that the signals must remain out of these areas, only the desired bursts are captured.
Visual Trigger Controls
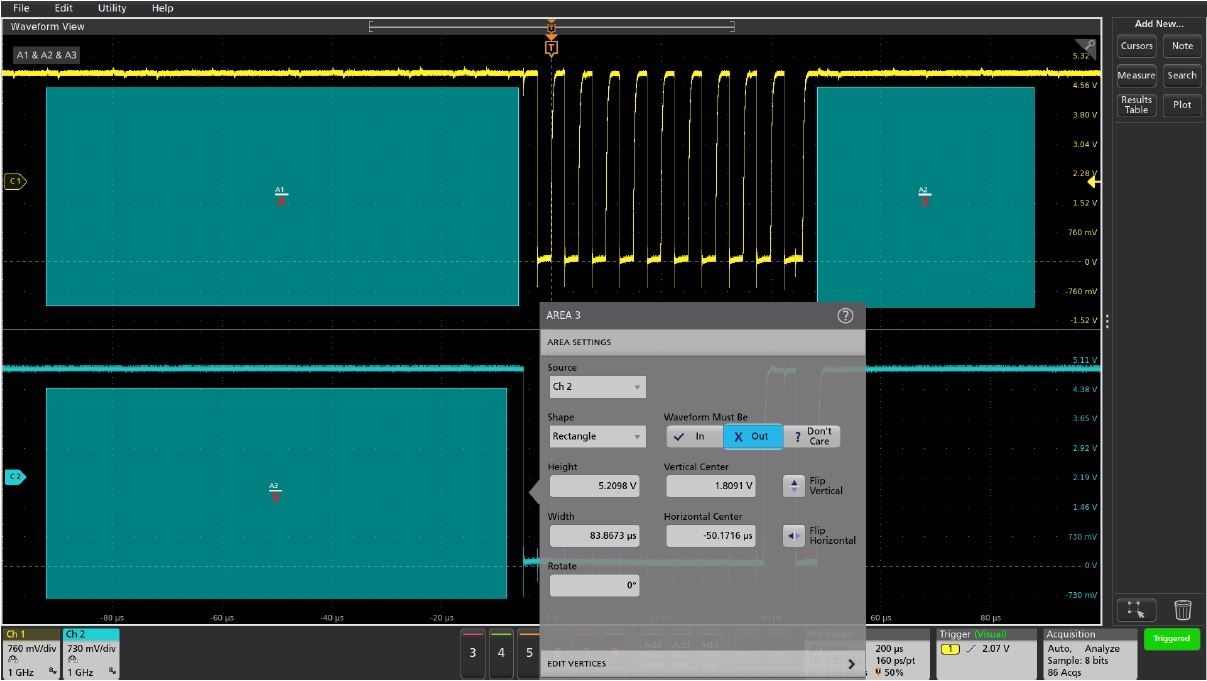
For more precise control of each Visual Trigger area, the configuration menu allows the user to edit the shape, size, and position of each area. Exact coordinates for the vertices for each area can be specified in amplitude and time values.
The Visual Trigger configuration menu in the example above shows the details that can be adjusted for each area.
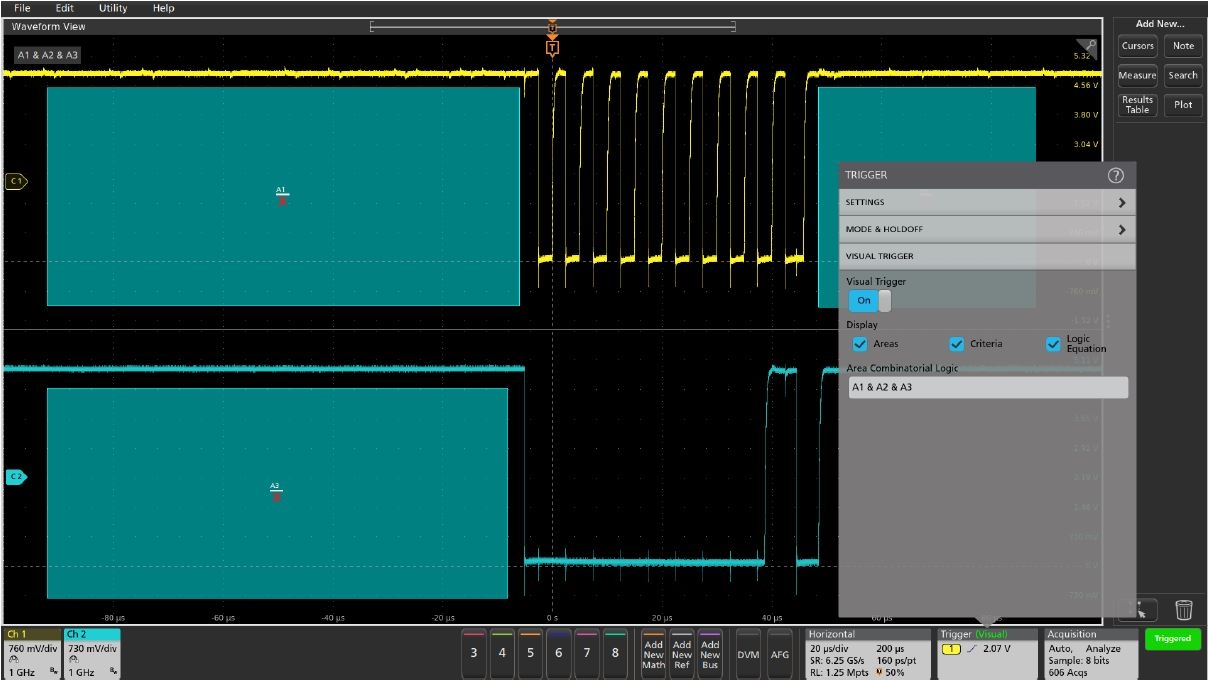
On the 5 Series MSO, 6 Series MSO and other scopes with the same user interface, Visual Trigger controls are found on the VISUAL TRIGGER panel in the Trigger configuration menu. Controls are provided to turn Visual Trigger on and off, customize the display, and enable editing of the Visual Trigger combinatorial logic equation. This equation describes how Visual Trigger will logically combine the areas to determine which acquired waveforms are displayed and which are discarded.
More Advanced Applications
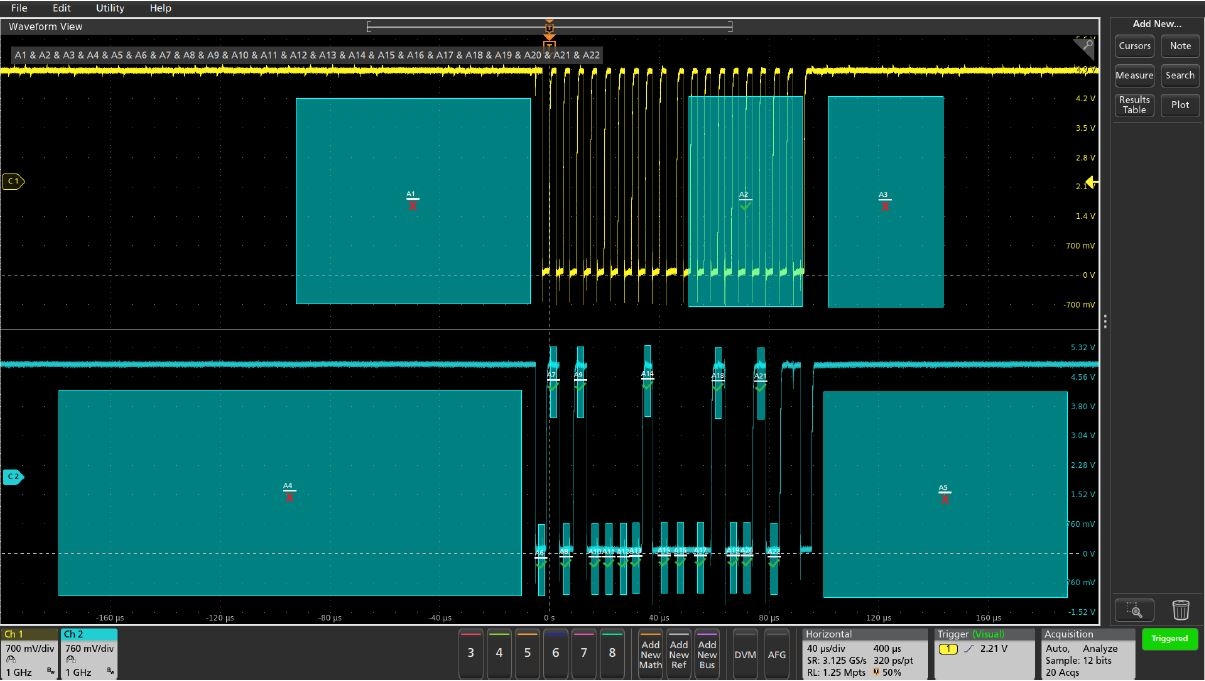
In the example above, Visual Trigger areas have been added to the I2C signal to build a custom serial pattern trigger.
Visual Trigger areas 1 and 2 provide framing for the serial signal, capturing only signals that occur after the clock (yellow channel 1 signal) has been idle for an extended period of time, and when the clock is long enough to support both an address and a data packet.
The remaining areas are used to specify the serial data pattern (cyan channel 2 signal) which is sampled at the rising edge of the clock signal. In this case, the pattern of areas captures bus reads from binary I2C address 101 0000 followed by the binary data value 0001 0010.
The horizontal positions of the areas for the data pattern can be adjusted to correspond to the valid setup and hold timing around the clock edges, and the vertical sizes and positions of the areas can be adjusted to correspond to valid high and low logic levels.
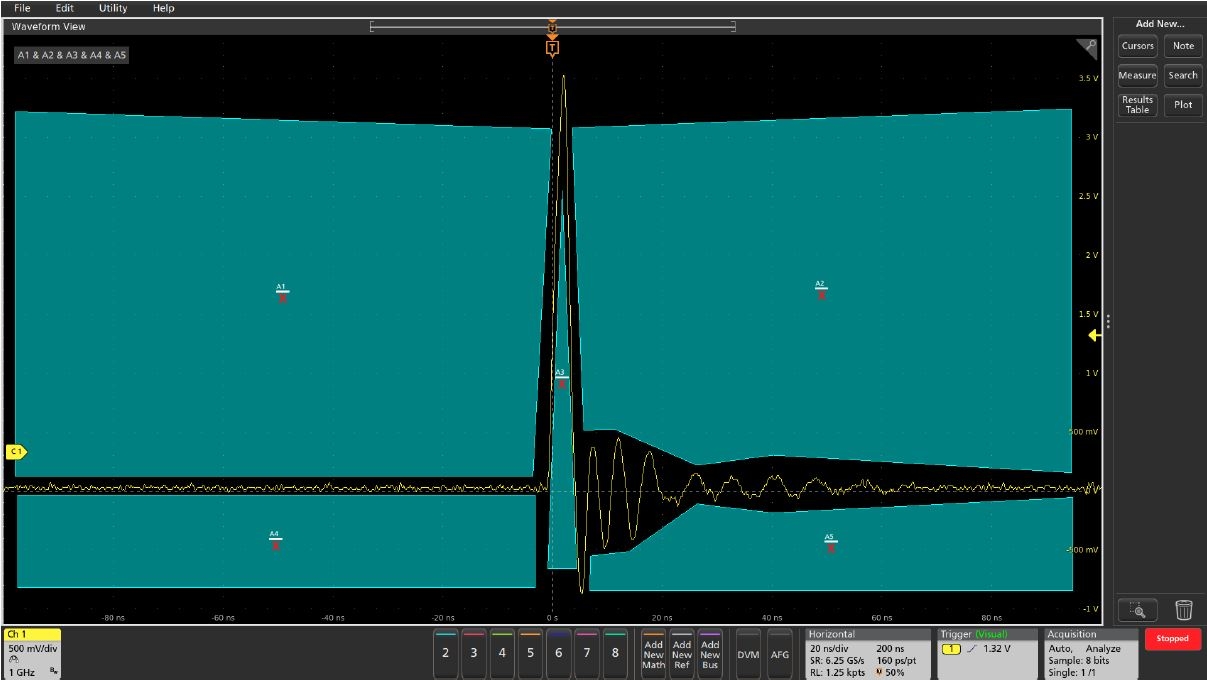
By default, Visual Trigger areas are rectangles. But Visual Trigger areas can be edited to define very complex shapes.
In this example, Visual Trigger areas have been extensively edited and then used to capture only signals with a specified pulse width and amount of ringing.
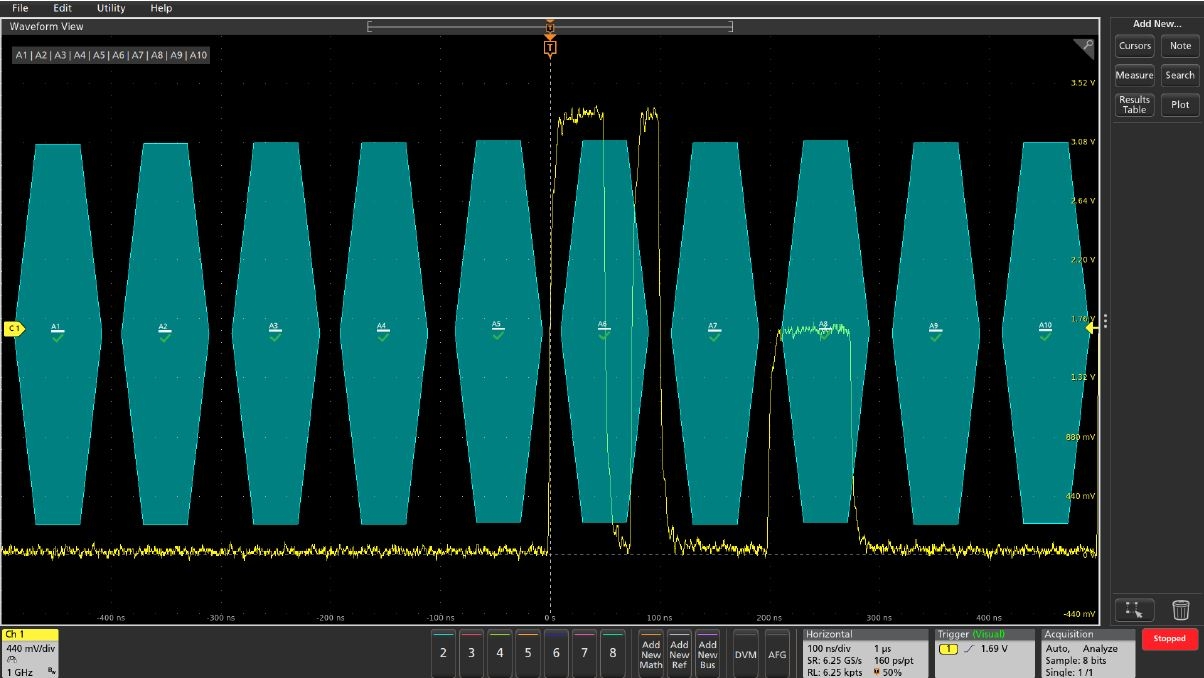
This example shows how Visual Trigger can be used in an unattended monitoring application to capture infrequent anomalies. First, a hexagonal area is placed in the center of each unit interval of this CAN signal. Then the logic equation is edited to logically OR all of the areas together. Finally, infinite persistence is used to capture all trigger events while the circuit is running for an extended period of time. Only the “mask” violations are captured.
Visual Trigger extends the Tektronix oscilloscope’s triggering capabilities beyond the hardware trigger system, enabling easy and efficient definition and capture of important events in complex signals. By automatically capturing only the most important signal events, hours of capturing and manually searching through acquisitions for the right signal can be reduced to seconds or minutes.


