Using Oscilloscopes in power analysis of Switching Mode Power Supply (SMPS)
- 11 Dec 2020
Contents
- Preface
- Introducing GW Instek GDS-3000 Power Analysis
- Power Quality
- Harmonics
- Ripple and Noise
- In-rush current
- Summary
Preface
The main purpose of a switch mode power supply is to convert the AC power into a stable DC power applied to a variety of electronic products. Switching mode power supplies, based on their function, can be divided into AC/DC (AC to DC power supplies) type and DC/DC (DC to DC power supplies) type. SMPSs are widely used in computers, office automation equipment, industrial control equipment and communications equipment. The trend of SMPS will go toward smaller, lighter and more efficient power supplies. This document will introduce how an oscilloscope can be used for power analysis of SMPS, such as ripple, power quality and harmonics.
SMPS comprises passive, active and magnetic components, as shown in figure 1. The Switch Regulator circuit uses MOSFET, IGBT or other switching devices to regulate voltage by quickly switching between on and off states. When ON, the forward bias of the switch provides close to zero impedance; when open, the switch has very high impedance. By modulating the duty cycle of ON or OFF state, a stable voltage can be acquired. The relationship between output voltages over time is shown in Figure 2.
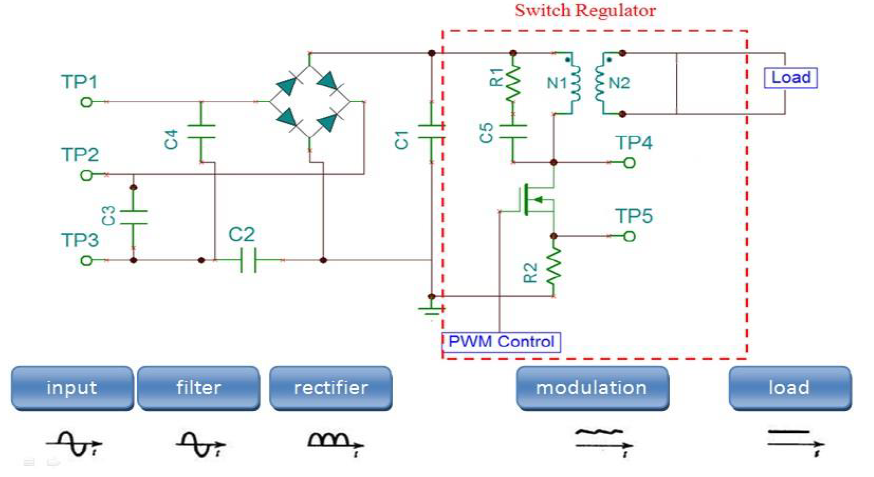
Figure 1: SMPS circuit diagram
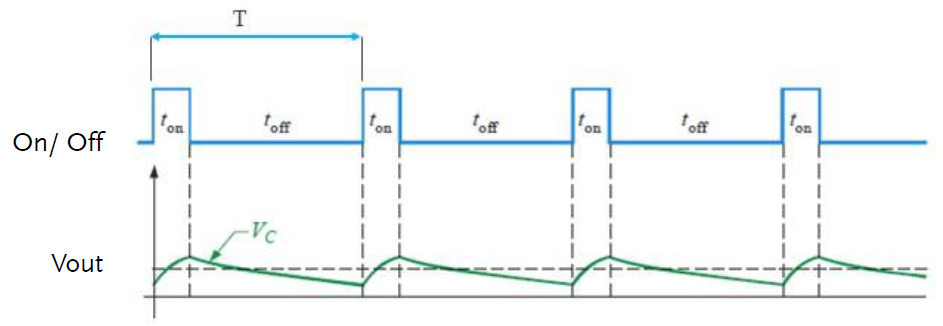
Figure 2: SMPS voltage at the switch and at the regulated voltage output
In general, the average voltage in the load is:
VO(avg) = (ton/T) x Vi
From the equation, the average voltage output (VO) is partly determined by the voltage on time (ton); a short voltage on time (ton) results in a lower voltage output. A PWM controller is used to control a switching device (MOSFET, IGBT) to create a stable pulse width modulated (PWM) voltage with a switching frequency of up to 20MHz. Higher switching frequencies produce more stable outputs by reducing the output voltage ripple.
Introducing GW Instek GDS-3000 Power Analysis
The optional power analysis software, dedicated to GDS-3000, includes power quality, harmonics, ripple, and inrush current measurement functions. These functions allow you to use an oscilloscope to easily obtain power analysis data without the cost of acquiring expensive test equipment such as power meters. The power analysis software functions are described below:
1. Power Quality
When designing a switching power supply, engineers need to assess the quality of primary side. In reality, the voltage and current waveforms are not ideal sine waves and they contain distortion and abnormality. This abnormality affects power consumption, efficiency and reliability. As such, it’s important to measure power quality.
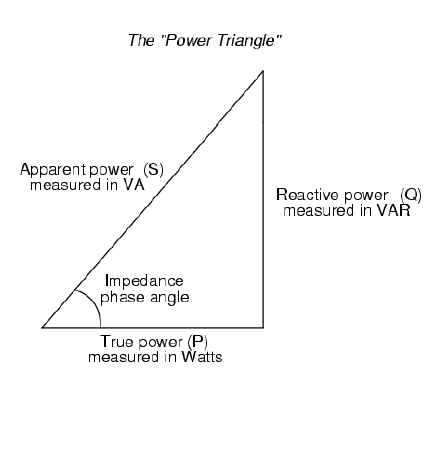
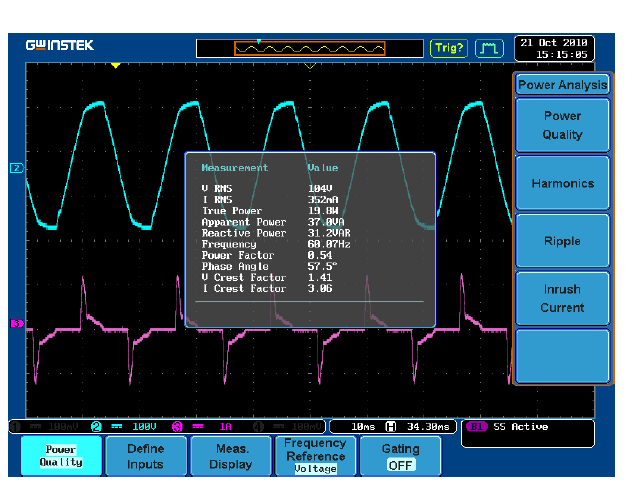
The GDS-3000 power analysis software not only provides Apparent Power, True Power, Reactive Power and Power Factor (refer to Figure 3) but also contains other useful measurements associated with power quality (refer to Figure 4).
|
Figure 3: Power triangle |
Figure 4: GDS-3000 power analysis illustration |
2. Harmonics
If a load is linear, then current and AC power would be an ideal sine wave without distortion. However, if a load is nonlinear, like a rectifier load, the current waveform will be distorted. For example: If a voltage has a frequency of 50Hz, the distortion of the current waveform can be analyzed by the Fourier transform. The Fourier transform can decompose the current waveform into its fundamental frequency (50Hz), and its harmonic frequency components (100Hz, 150Hz…etc.). In recent years, the extensive use of rectifier loads has resulted in the emergence of a large number of harmonic currents, indirectly polluting voltage. To ensure the purity of the mains voltage, standards such as IEC61000-3-2 have been imposed to regulate power quality.
The Harmonics test function in GDS-3000 includes industry standard IEC61000-3-2 testing (Figure 5) with device class selection (Class A/B/C/D) to meet a variety of application needs (See table 1, 2). For example, Class A tests three-phase power equipment, home appliances, dimmer switches and audio equipment, etc. Class B includes portable power tools and non-industrial power equipment. Class C tests lighting while class D tests television receivers, personal computers and monitors with a power rating of less than 600W. Therefore the Harmonics function is able to not only calculate harmonic distortion but also calculate IEC 61000-3-2 test results immediately. Selecting the relevant test standard is shown below:
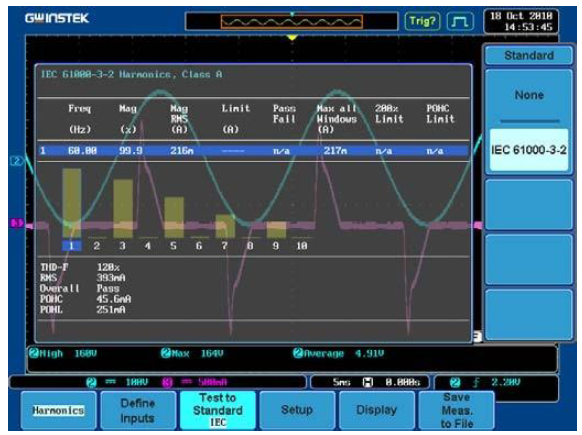
Figure 5: The GDS-3000 Harmonics function
Table 1: IEC61000-3-2 Class A/B/C/D classification:
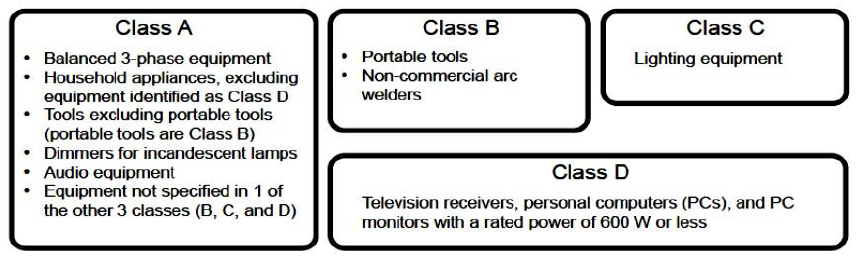
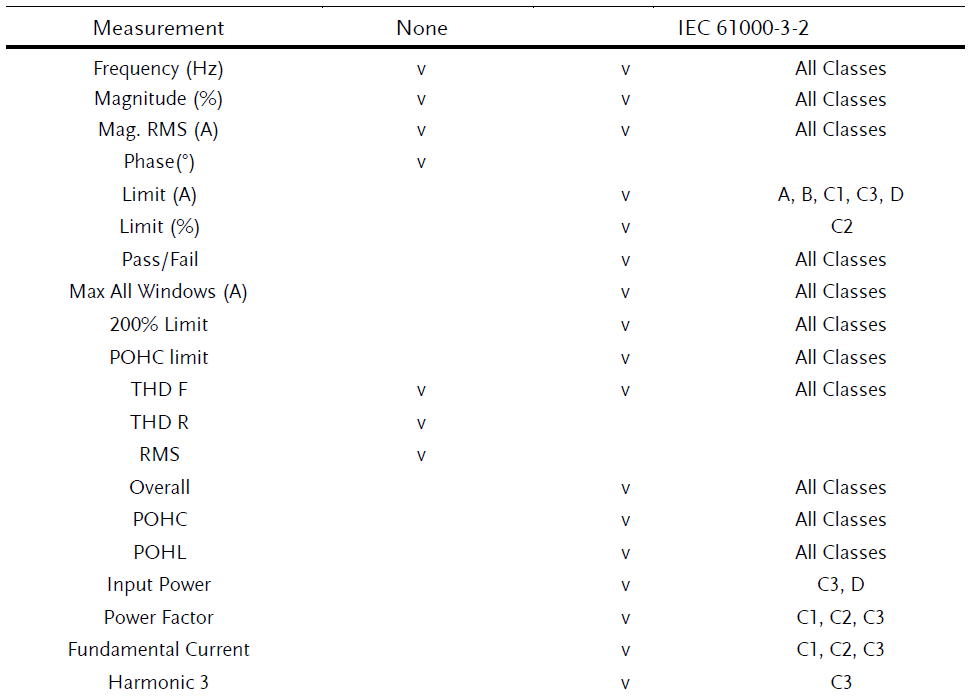
Table 2: When measuring harmonic distortion, the GDS-3000 can to test to the IEC61000-3-2 test standard or to no standards:
(None). The related test items for both choices are shown in the table below.
3. Ripple and Noise
Ripple: The whole output noise of switching power supply can be viewed as the combination of ripple and noise (see Figure 6). Ripple is the output voltage fluctuation caused by the charge and discharge of a switching mode power supply. Power supply noise, usually referred to as RMS noise, characteristically has a low peak-to-average ratio and occurs at the fundamental switching frequency. As ripple is caused by the discharging and charging of the input and output capacitors, ripple can be reduced by increasing the input and output capacitance.
Noise: High-frequency noise spikes occur when switching mode power turns on or off. Although the repetition frequency of the noise is determined by the switching frequency, the frequency content of the noise spike is much higher than the switching frequency. The amplitude of noise spikes is highly dependent on the power supply topology, PCB layout and circuit parasitic. When noise occurs at a high frequency, noise spikes are vulnerable to probe or laboratory settings.
Compared to other oscilloscopes that only measure ripple, the GDS-3000 is also able to measure noise. This allows you to better assess power system completely.
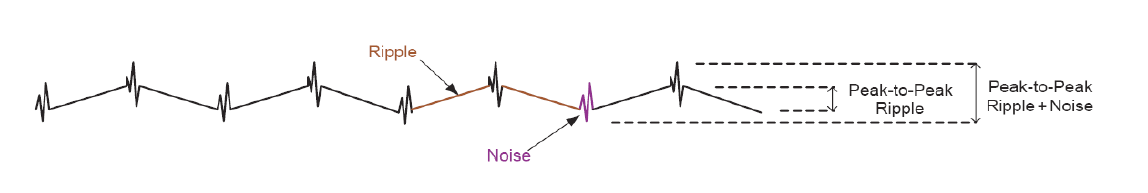
Figure 6: Ripple and Noise schematic
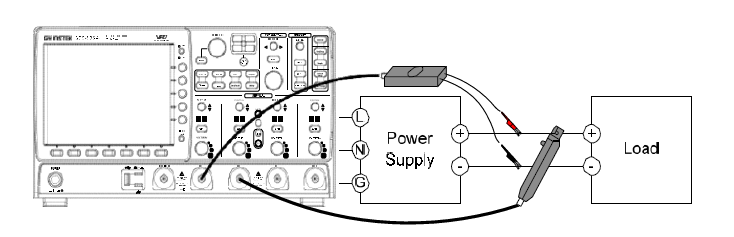
Figure 7: Ripple/Noise test setup
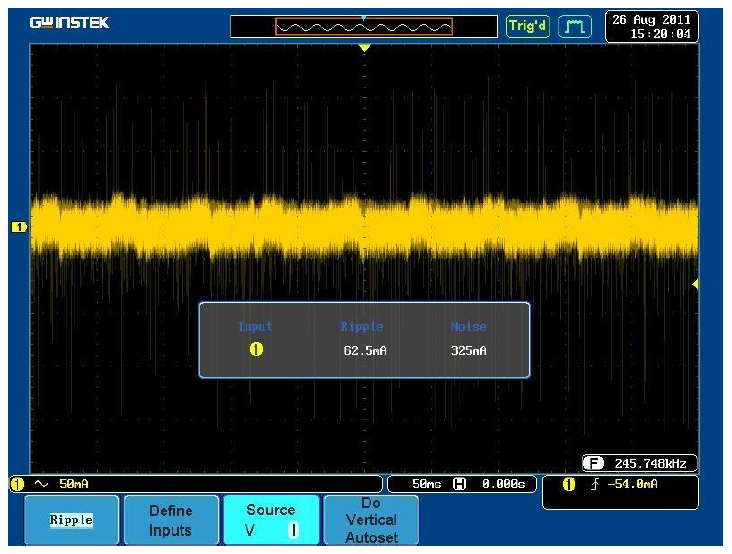
Figure 8: Ripple/Noise diagram of measurement results
4. In-rush current
Inrush current, or surge current, from a switching mode power supply can be defined as the peak instantaneous current that is generated when the power supply is first turned on. The Inrush current is caused by filtering capacitors acting as short circuits when a power supply is first turned on. Engineers should note the inrush current generated at startup because a large inrush current can cause damage to the whole system.
The peak instantaneous current is often measured to ensure that the charging current of a power supply’s input capacitor does not exceed its maximum current rating or that of any other component in the power supply. The GDS-3000 power analysis software is able to measure the first peak inrush current to allow engineers to easily select fuse specifications, eliminating the need for time-consuming manual calculations. In addition to measuring first peak inrush current, the GDS-3000 is also able to measure second peak inrush current to easily observe changes to instantaneous power (See figure 10). The measurement diagram is shown in figure 9.
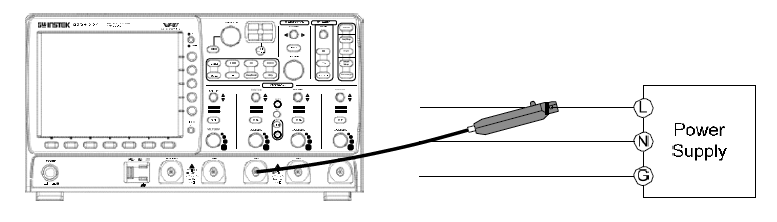
Figure 9: Inrush current test setup
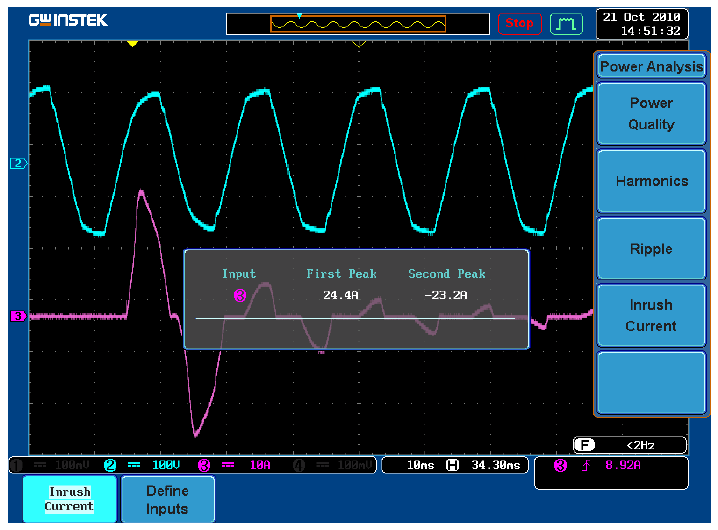
Figure 10: Inrush current test illustration
Summary
Today, switching power supplies are widely used in various fields. The GW Instek GDS-3000, with the power analysis software, allows power quality, harmonics, ripple and inrush current to be measured. These tools enable you to replace the traditional power meter, reducing your total investment to acquire a complete set of tools.
GDS-3000 series is an innovative testing platform providing up to 500 MHz bandwidth, 4 analogue input channels, 5GSa/s, and VPO technology (Visual Persistence Oscilloscope). Beside these, it also equips an innovative split-screen system with independent horizontal settings, vertical settings and triggers. This is a new function which can be used for testing, research, and manufacturing. With power analysis and serial bus analysis software, GDS-3000 series also enables engineers to expedite product testing, developing, and manufacturing.
The GDS-3000 series offers a range of optional differential and current probes for power analysis and testing: 3 differential probes: 25MHz/1400Vp-p X200 attenuation, 50MHz/7000Vp-p X1000 attenuation and 100MHz/7000Vp-p X1000 attenuation; 5 current probes: 50MHz/30A ;100MHz/30A;1kHz/50A ;100kHz/100A and 40kHz/240A etc. The GDS-3000 is a complete power analysis solution to meet all kinds of power supply testing applications.
GDS-3000 Series Features:
- 500/350/250/150MHz, 2/4 Channels
- 5GSa/s RT or 100GSa/s ET Sampling Rate
- Independent Memory for Each Channel
- VPO Technology
- Large 8-inch 800x600 Display
- Split Screen Function
- 3 Built-in Impedances (50Ω/75Ω/1MΩ)
- Power Analysis Software (Optional)
- Serial Bus Analysis Software for I2C, SPI and UART (Optional)
GW Instek GDS-3000 Oscilloscope Product Pages


